
This upcoming article about SQL Server will demonstrate to you how you’ll create pivot tables. Once the publication about Excel explains to you some basic pivot query in SQL Server, it’s going to be time to move on to some SQL construction.
PIVOT tables in SQL Server
We’ll use Adventure Works as our example, then pivot our data from this sample database. Next, we’ll execute this query and get back a list of customers, products, and product variants, grouped by state. This query will return a list of customer orders, products, and product variants, grouped by state. After evaluating it, we will use it as the template to create the final query for summarizing the data.
We use a JOIN clause:
SELECT SO.CustomerID, SO.SalesOrderNumber, SO.OrderDate, SO.TotalDue, ST.Name AS 'Territory'
FROM Sales.SalesOrderHeader SO
JOIN Sales.Customer AS C ON SO.CustomerID = C.CustomerID
JOIN Sales.SalesTerritory AS ST ON C.TerritoryID = ST.TerritoryID
WHERE OrderDate BETWEEN '2013-01-01' and '2013-12-31';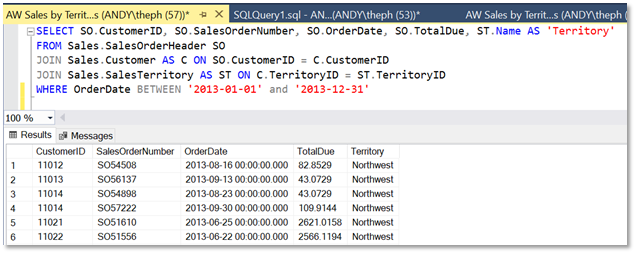
PIVOT operator syntax
The PIVOT operator has the following structure:
SELECT
<the data you want to display>
FROM
(
<the SELECT statement that gets the data>
) AS <Alias for temporary table>
PIVOT
(
<aggregation function>(<column being aggregated>)
FOR [<column that contains the values that will become column headers>]
IN ( [first pivoted column], [second pivoted column], ...
    [last pivoted column])
) AS <alias for the pivot table>
<optional ORDER BY clause>;
Let’s create a pivot table using the data in the following dataframe. The script first extracts the first four columns, and then creates the pivot table. The second part of this reflection contains three key terms to understand.
- When you’re running an SQL statement, the AGGREGATION function specifies how to group values from Pivot tables are a powerful tool for summarizing data from many rows into fewer rows.
- FOR is a marker that identifies which columns of data will be brought into the PIVOT operator. These are the primary columns that contain values and the titles that will be given to the column headers.
- The IN keyword lists all the distinct values from the column we are pivoting and that we want to see as column headers.
Now that we have real data, the syntax is even easier to understand. Let’s go back to our AdventureWorks example.
PIVOT Operator in action
The following example script retrieves sales data from the example table, displays it per region, and formats it for month-by-month reporting.
SELECT * FROM (
SELECT FORMAT (SO.OrderDate, 'MMM') as OrderDate, SO.TotalDue As 'TotalSales', ST.Name AS 'Territory'
FROM Sales.SalesOrderHeader SO
JOIN Sales.Customer AS C ON SO.CustomerID = C.CustomerID
JOIN Sales.SalesTerritory AS ST ON C.TerritoryID = ST.TerritoryID
WHERE OrderDate BETWEEN '2013-01-01' and '2013-12-31'
) AS SalesResults
PIVOT (
  SUM([TotalSales])
  FOR [OrderDate]
  IN (
    [Jan],[Feb],[Mar],[Apr],[May],[Jun],[Jul],[Aug],[Sep],[Oct],[Nov],[Dec]
  )
) AS Pivot_SalesRegionMonth
ORDER BY Territory;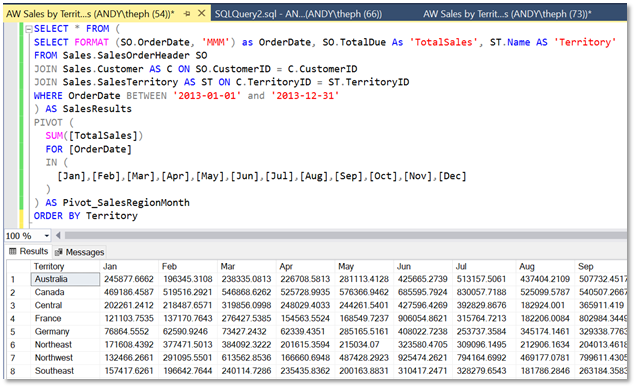
PIVOT Operator – limitations
For anyone who is familiar with the pivot table feature in Excel, you’ll see some differences with the PIVOT operator in SQL. We could refer to these tools as “limitations,” because in Excel the Pivot Table feature has no such problems. This means that the PIVOT operator can be used only once.
For example, say we want to see the number of sales orders in each month for each region alongside the sum. Then, we wouldn’t just add COUNT(TotalSales).
We’ve learned how to use the PIVOT operator in SQL Server to create a pivot table. It will pivot one or more columns into rows. But when it comes to using the PIVOT operator, there are a few limitations. One of them is that we need to hardcode our pivot column headers. This is not an issue because there are only 12 months in a year. We don’t need to add pivots after each month has been created.

